Plant operators move from −22 to ~0 — and lost-time injuries follow.
HQ scored +31 while plant operators sat at −22 — a textbook detachment of management from the front line. “Voice of the line” loops, supervisor upskilling and predictable rostering closed the gap.
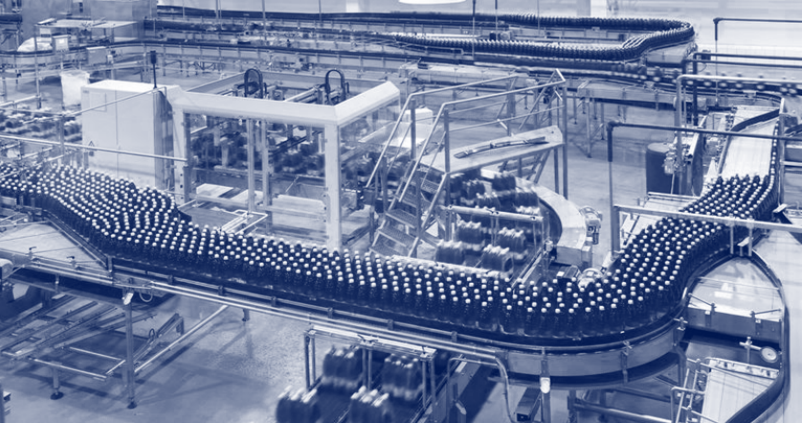
The challenge
A local production group consisting of food processing plants and headquarters, employing 4,500 FTEs, initially compared poorly to manufacturing eNPS benchmarks sitting around +15 to +18 in recent years. Management and support services seemed detached from the front line — and safety incidents and unplanned downtime were higher at the lowest-eNPS plants.
Baseline diagnostics
Site-level semi-annual pulse scored the group at +4 overall — masking a sharp split between white-collar HQ and blue-collar plant floor.
Voice of employees
Frontline comments were sharp, repeated and uncomfortable:
“Old equipment and safety concerns.”
“No time for breaks.”
“Shift swaps hard with no hand-over.”
“Nobody listens from white collars.”
Interventions
- 01
“Voice of the line” loops
Shift leaders ran monthly stand-ups where operators prioritized three improvement ideas — leadership had to commit to two per month per line. This triggered safety and ergonomics sprints with quick wins: better lighting, micro-breaks, automation of repetitive tasks.
- 02
Supervisor upskilling
Recognized supervisors received formal people-management training and coaching from internal coaches — not just technical upskilling.
- 03
Predictable rostering
Management developed a transparent 4-week schedule with high visibility and transparent shift bidding for shift workers.
Outcomes
After 18 months, operators' eNPS moved from −22 to almost zero and operational KPIs followed — scrap and rework dropped most in the plants with the highest eNPS gains.
“Employee Net Promoter Score (eNPS): Logic and Evolution of this Ratio, current Benchmarks compared to iBDP, and selected Industry Case Studies”, Leadbacker, 2025. Pages 12–13. Composite, anonymized case based on patterns observed across Leadbacker client deployments.
Image: Unsplash.